During the pandemic, we spent countless hours making some essential content updates to our site and employing a shiny-new content strategy.
With such a dramatic shift in the way we engage and consume content, we were curious to see how things were going so far in 2021 and how they’ve changed since our last blog post!
DEVICE BREAKDOWN
We were curious to see if anything changed compared to our previous stats here and noticed a 10% increase in mobile users. That is helpful for us to be sure we are focusing on extra mobile testing to ensure any new updates are working for everyone.
SITE VISITORS
We were excited to see that the majority of our visitors were new, staying about the same compared to previous years!

HIGHEST PAGE VIEWS
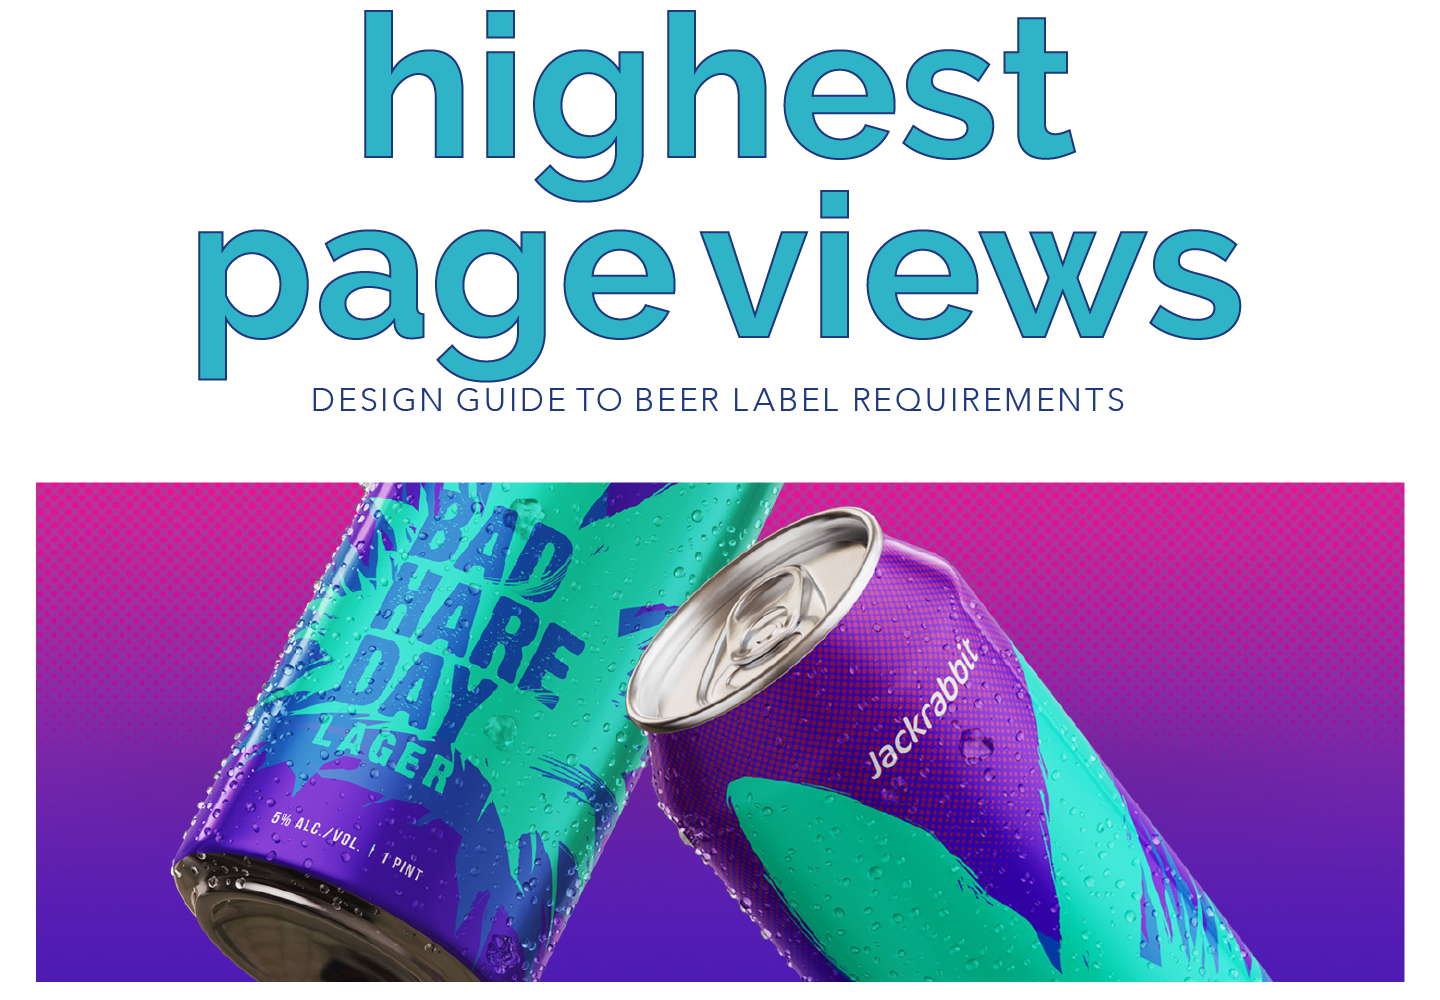
The area of our website that has been getting a lot of traffic is our blog! We have changed our focus on the types of content we want to share, and love seeing that our efforts are paying off. Fresh content is key to keeping traffic coming to your site! The most viewed blog post so far in 2021 is Design Guide to Beer Label Requirements by our resident beer expert, Lynn Spooner—featuring her Jackrabbit beer can design mockups.

REFERRALS
Since we switched up our strategy to post more on social media we’ve seen an increase in referrals from the various channels. LinkedIn is at the top of our referral list so far for 2021!
POPULARITY CONTEST
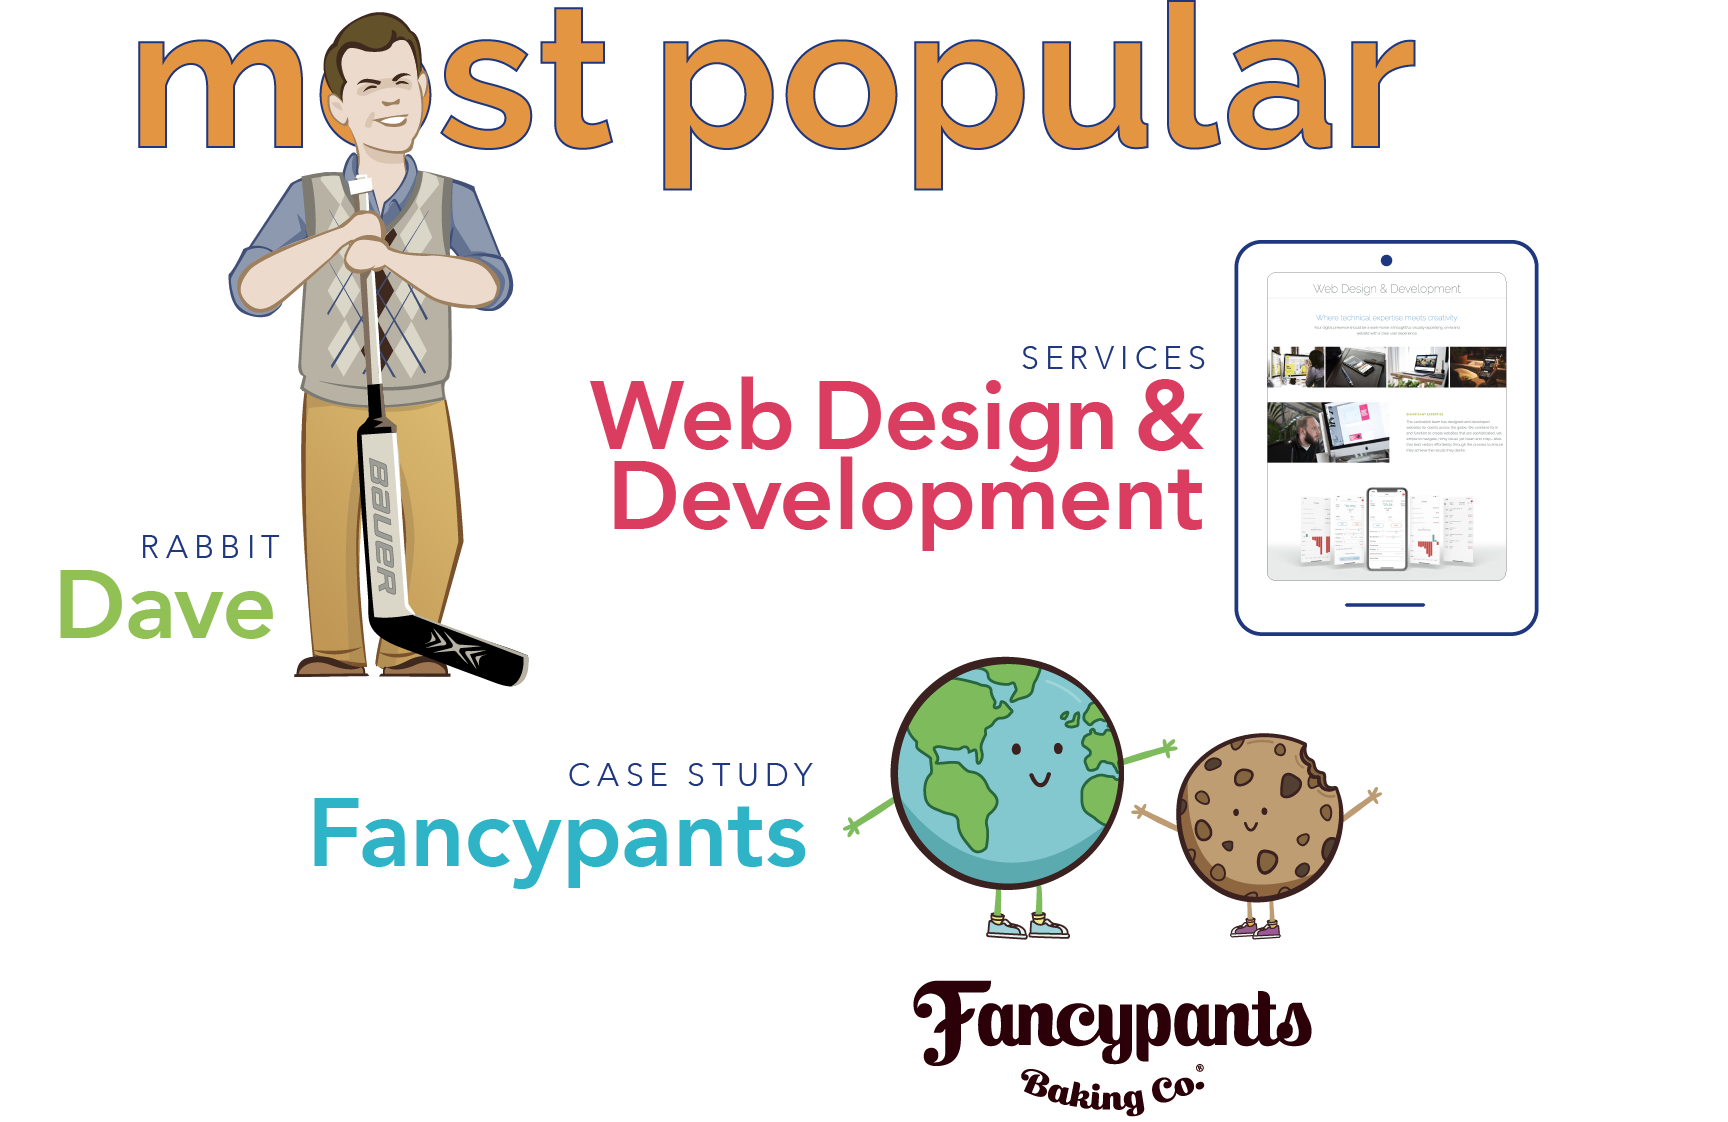
We’re not shocked to see that the favorite Rabbit around here is still the Head Rabbit, Dave! Our most popular Case Study is Fancypants Baking Co., who let the Rabbits handle everything from their cookie packaging, website redesign, and even their social media.
We were excited to see that some of our newer pages were getting significant traffic since we added a new Services section. Our most popular services page is Web Design & Development, which isn’t shocking based on the number of web redesign projects in the works!


